


This blog post is specifically tailored towards those who are new to Machine Learning or those who generally want to better understand how machine learning algorithms work behind the scenes.
In machine learning, regression models are used for predicting continuous variables. For instance, if you are looking to predict the price of a car based on certain attributes of similar cars that have been sold, a regression model is the model to use. There are several regression models available e.g. Decision Tree Regressor, Random Forest Regressor, Linear Regression, XGB Regressor etc. However, the focus of this post is (Yh, you guessed it 💡), Linear Regression.
How does the Linear Regression model make predictions 🤔? It simply fits a straight line through data points. Let’s take a trip back to basic algebra for a bit, If you do not have a mathematics background that’s fine, I’ll try to break things down as much as I can.
Say we have a plane labelled ‘y’ on the vertical axis and ‘x’ on the horizontal axis.
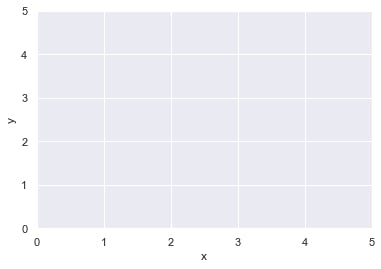
Any point or line on this plane can be represented in mathematical terms. Points are generally represented using a coordinate system while lines are denoted by equations.
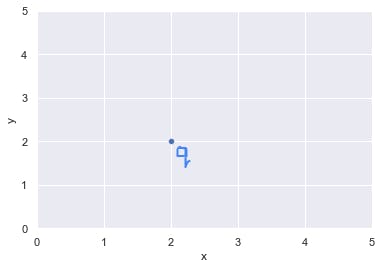
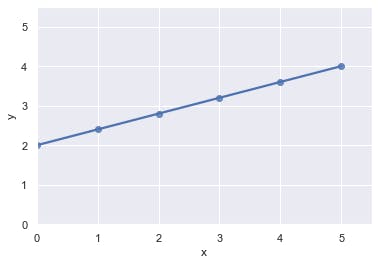
Take the point q above, this point corresponds to the number 2 on the y-axis and the number 2 on the x-axis as well, in mathematical terms point q is denoted as (2, 2). That is called a coordinate notation and it takes the general form (location on x, location on y). Let’s say q continues to keep with the theme of maintaining identical locations on x and y such that it moves up 5 places through (3, 3), (4, 4), (5, 5), (6, 6) and (7, 7). We can trace its path by marking its position on the plane at each instance and drawing a line through it.
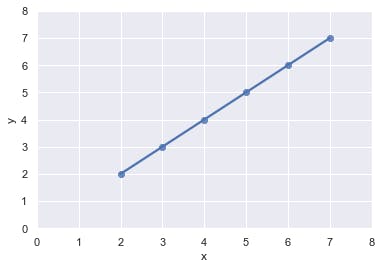
Oh look! Seems like q took a straight-line path to get from (2, 2) to (7, 7). Since q maintains this theme of keeping corresponding positions on both axes, we can represent q’s path mathematically with an equation y = x. y = x is the equation of the path (straight line!? 🤔) that q has taken.
At any point in time, as long as we know q’s position on the x-axis, we can determine its position on the y-axis as well. If q is at a point 23 on the x-axis, can you guess it’s position on y? y = x = 23 (look at you predicting like a machine learning model! 😲).
In general, the equation of a straight line takes the form y = mx + c (what!? 🤯). Yh, I know this looks nothing like the equation of q’s path (or maybe it does!) but let me break it down a bit. Let's introduce some new terms, m is the slope of a given line. Slope simply means how inclined a line is, c on the other hand is the intercept or more specifically, the y-intercept. The intercept is the point where a straight line touches the y-axis.
$$y = mx+c$$ $$m = slope$$ $$c = intercept$$
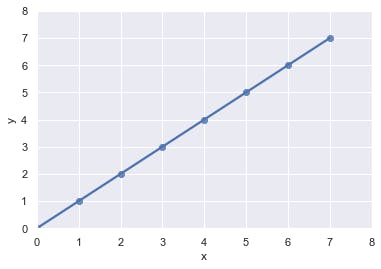
Imagine a line where slope, m = 1 and intercept, c = 0, the equation of that line becomes y = 1(x) + 0 which will equate to y = x (looks familiar? 👀). Yes in-fact, q’s path indeed has a slope, m = 1 and an intercept, c = 0; no I’m not just making this up, I’ll prove it. Let’s say q moves downwards form (2, 2), through (1, 1) until it gets to a point (0, 0). At this point, q touches the y-axis at a point 0, sorry, I meant to say q intercepts the y-axis at a point 0! (get it?). Therefore, intercept c = 0.
Now for the slope, slope m is defined as how much of a horizontal change is produced for a corresponding vertical change (oh great! 😬), I’ll explain. This simply means slope is how much x (horizontal) changes as y (vertical) increases or decreases. Let’s take a look at q’s path again, as q goes up by 1 on the y-axis (say from 2 to 3), x increases by 1 (2 to 3), therefore slope m = 1 (told you 😏).
Let’s consider a new point, p with a path shown in the figure below.
Ha! Not quite as deductive anymore now is it? No, it actually isn’t complex, let’s try to figure out the equation of p’s path. First thing to do is to write out the general form of a straight line y = mx + c; already we can see that c = 2 since the line intercepts the y-axis at y = 2. Now we need to determine the value of slope m. Remember the definition of a slope? (how much of a change occurs in x when y changes right!?), you'll agree that it makes sense to say slope m is the magnitude of x’s change when y changes, so we can say:
$$y_2 - y_1 = m(x_2 - x_1)$$ $$ \Delta y = m \Delta x $$ $$m = \Delta y / \Delta x$$ $$(wow! \ Slow Down! 🤯)$$
Don’t worry, I’ll break it down (it’s what I do). A change in position from a point 1 to a point 2 is simply the difference between the values of point 2 and 1, 'Δ' (pronounced 'delta') is just a fancy way of representing that change. So slope m is mathematically defined as a change in y divided by a corresponding change in x. But how do we determine Δy and Δx? We simply go back to the plot, pick two points on the x axis trace them up to the line and them trace them backwards till we get to the y axis as shown below;
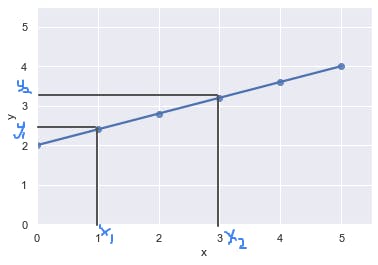
$$y_1 = 2.4, y_2 = 3.2, x_1 = 1, x_2 = 3$$ $$m = \Delta y / \Delta x$$ $$ \Delta y / \Delta x = (3.2 - 2.4)/(3 - 1)$$ $$ \Delta y / \Delta x = 0.4$$ $$m = 0.4$$
The equation of the line becomes y = 0.4x + 2, we can now predict y provided we know what x is. For instance, say p is at a point x=17, its position on y is y = 0.4(17) + 2 = 8.8 (careful now, you are starting to act awfully like a linear regression model! 🤖).
Lastly, let’s consider a point e, just like p and q, e would also like to move around the plane, but unlike p and q, e is rather erratic. Pulling up a graph (graph? I thought it was called a plane 💁, don’t worry, they mean the same thing in this instance) of e’s path reveals how erratic e has been.
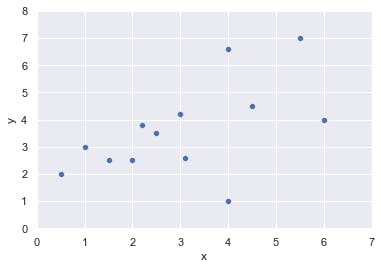
Looking at the distribution of points, I think we get a sense that e wants to move up the plane, we can actually give e a hand and attempt to help it stay on course by drawing a straight line through positions where there are a cluster of points like this;
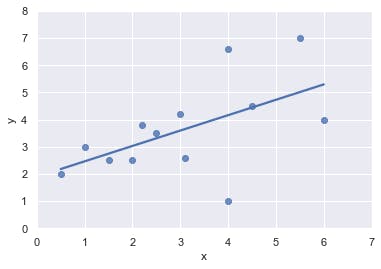
Now we can help e determine how to move on a straight line by deriving the equation of that line. But wait! This line doesn’t touch the y-axis so there's no intercept, right?! Except it does, we just didn’t draw it out long enough. Every straight line on a plane has a y intercept, even if its zero or a negative value. How then do we determine the equation of this line as the graph provides no visual ques?! (No way, it can't be done! could it? 😶), I’ll break it down (Yh, it’s kind of becoming my thing 🔨).
Remember m=Δy/Δx? Turns out we can use that equation without knowing the value of intercept c, so let’s start form there. Picking two points on the x axis x1 and x2, tracing them vertically till they touch the line and then tracing them backwards to y just as we did for p:
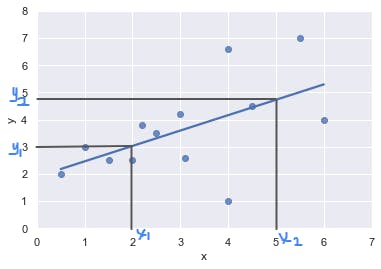
$$y_1 = 3, y_2 = 4.7, x_1 = 2, x_2 = 5$$ $$m = \Delta y / \Delta x$$ $$m = (y_2 - y_1) / (x_2 - x_1)$$ $$m = (4.7 - 3)/(5 - 2)$$ $$m = 0.56$$
Now recalling the equation of a straight line y = mx+c, since we now know what m is, all we need to do now is to take a point on x and find its corresponding value on y, plug it into the equation and determine c. Lets pick x=2, y=3 (x1 and y1), the equation becomes:
$$x = 2, y =3$$ $$y = mx + c$$ $$3 = 0.56(2) + c$$ $$c = 3 - (0.56 * 2)$$ $$c = 1.9$$
The equation which will help e move on the straight line that we defined becomes:
$$y = 0.56x + 1.9$$
Say e turns down our help and continues on its erratic journey up the plane, then we get news that it got stuck at a point x=34 and needs to be rescued 🚑, to determine where to send the rescue team, we need to have a sense of e's approximate coordinates. We can predict e’s position on the y-axis using the equation we just derived:
$$y = 0.56(34) + 1.9$$ $$y = 20.94$$
While there is no guarantee that the rescue team will find e at coordinate (34, 20.94) since it's movement is erratic, there’s a good chance it would be close by, (So you mean there might be some error in our prediction of e's position on y? 😬). Welcome to the show which is machine learning. 🎬
Next post we'll explore what all of this means in the context of a machine learning Linear Regression model. 🙂